Beating the 21 + 3 Blackjack Side Bet: Some Really Cool Graphs

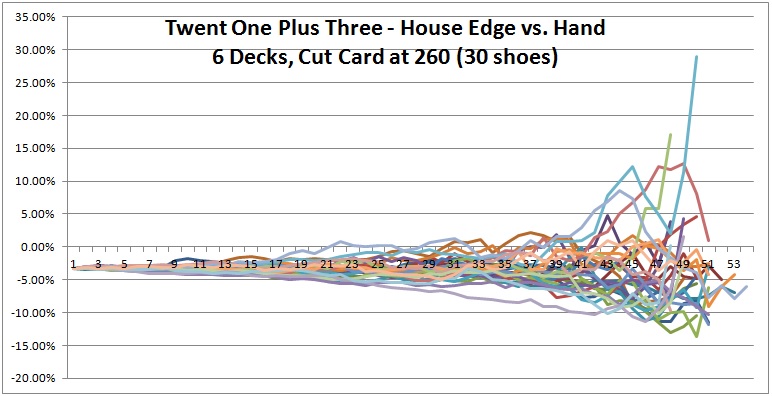
It continues to amaze me that my posts on the 21 + 3 blackjack side bet are among the most frequently viewed articles on this site. This post (Beating the 21+3 Blackjack Side Bet) tops the list. Out of curiosity, I created a computer program to look at how the edge for 21 + 3 changes as hands are dealt from a shoe. To be more specific, I considered a six-deck shoe with the cut card placed at 260 cards. For each hand, my program computed the exact edge for the 21 + 3 side bet based on the exact composition of the remaining cards in the shoe. I then used these edges on each hand to create a graph for the house edge for the 21 + 3 blackjack side bet over that shoe. I then repeated this experiment for 30 shoes.
As a reminder, the 21 + 3 blackjack side bet is based on the values of the three cards consisting of the player's first two cards and the dealer's up-card. If these three cards form a straight, a flush or trips, then the player wins 9-to-1. The following table gives the combinatorial analysis for 21 + 3:
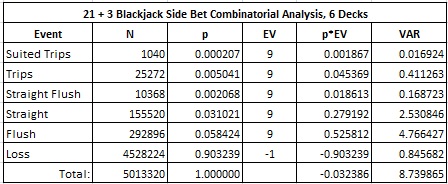
In particular,
- The house edge is 3.2386%
- The hit frequency is 9.6761%
- The standard deviation is 2.9563
As for the computer simulations, to make the data a bit easier to compare and contrast, I plotted 10 shoes per graph and created three graphs (see below). Each line in each graph represents the house edge for the 21 + 3 blackjack side bet over a single six-deck shoe with the cut card placed at 260 cards (1 deck from the end). Click on an image to see it full-sized.
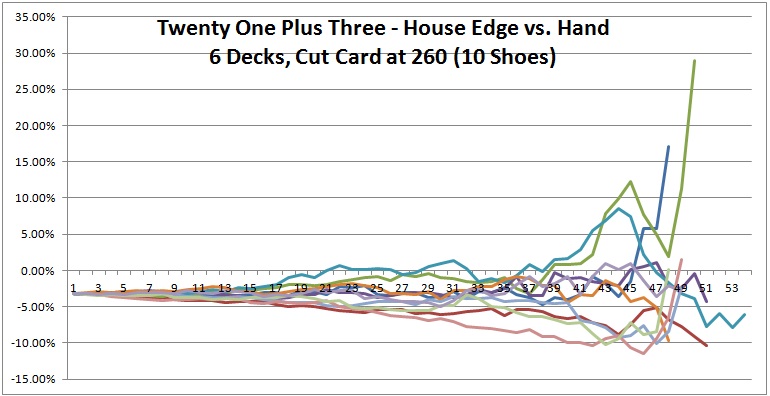
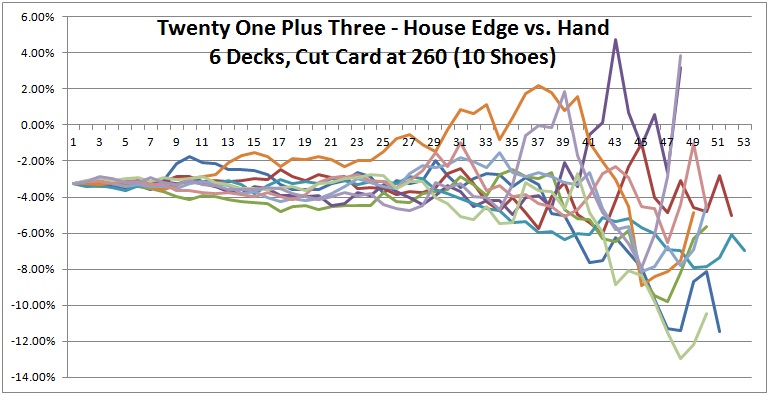
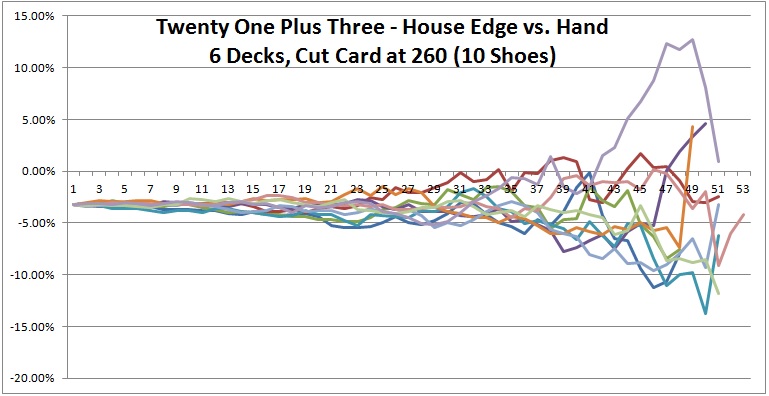
Everything starts at the same value at the far left of each graph, -0.032386 (the house edge). As each of these 30 shoes proceeds, their edges separate (become more "wiggly") and move through a progressively wider range of values. These graphs illustrate exactly why deck penetration is so crucial to advantage play. Things don't always favor the player, but the deeper the penetration, the more chance there is of getting an opportunity. For example, in the first graph above, there is an opportunity to make a 21 + 3 bet with more than a 25% edge over the house!
Now, let's say you play 49 hands out of a six deck shoe, and you have been paying attention to the shoe, patiently entering all the cards into your custom computer program on your cell phone, transmitting the signals to the guys in the van by the river who are signalling back to your teammate how you should play the next hand. Your teammate stares at you and winks. You make your $25 bet. The pit boss nervously checks out your unexpectedly large wager. The 50th hand comes out, and you think, what are the chances I have the edge now?
The following graph was arrived at by simulating the edge for one million (1,000,000) six-deck shoes at the 50th hand (assuming you are playing heads-up against the dealer). It shows the range of edges that occur, and the rough probability of each edge. Note that this is definitely NOT a normal distribution (click on the image to make it larger):
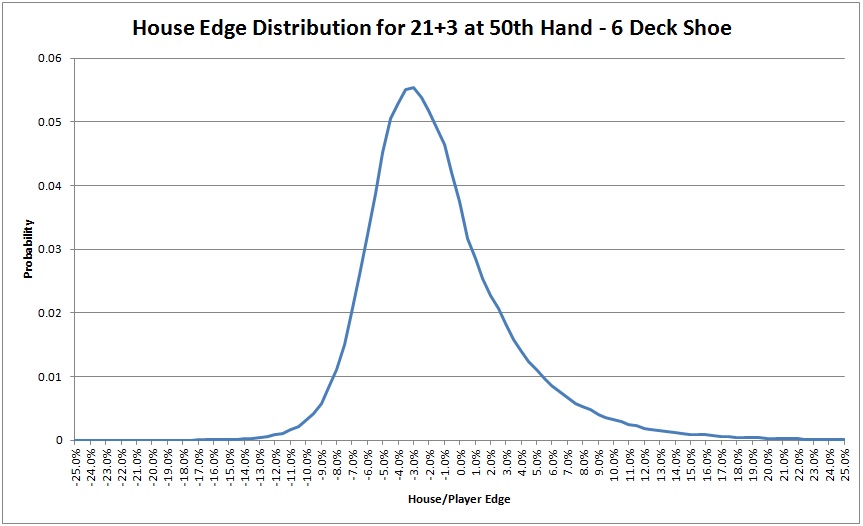
One thing this graph teaches is that it is quite common for the edge on 21+3 to be in the 5% to 10% range on the house's favor towards the end of the shoe. However, it is quite rare for the house edge to get above about 13%. On the other side of the distribution, the edges on the player side sometimes get over 20%. Simply put, the frequent occurrences of medium-high house edges are compensated for by the infrequent occurrences of very high player edges. In layman's terms, the distribution is "skewed to the right."
The following graph combines all 30 six-deck shoes given in the three graphs above. If you squint just right, you can see the skew in the distribution:
Surely there are many more lessons to be learnt from these graphs. Until I figure out what those lessons are, I am sure you agree that these are pretty cool graphs!


